7. Social-Economic Impact Assessment
The main objective of Socio-Economic Impact Assessment study is to assess the potential social and economic impacts of the proposed Kalpasar project across the Gulf of Khambhat, Gujarat. According to one of the studies, the alignment length of the proposed Kalpasar Dyke covers the administrative boundaries of 6 districts, 15 talukas, and 302 villages. Accordingly, to assess the socio-economic impacts of the proposed dyke, a detailed survey of households was carried out in 30 villages in the Bhavnagar and Bharuch districts. To access the baseline information of these villages and to have qualitative interactions with the people of the villages, a structured questionnaire was used. A close-ended questionnaire was designed with 14 indicators which were focused around the social and economic policy parameters of the society. Accordingly, the questionnaire was designed keeping in mind the information ranging from the individual households as a unit of analysis and its larger interactions with the society on multiple heads.
In addition to the attribute information, geospatial coordinates and altitude information were captured for each household to better serve and explain the social dynamism in the study area. The survey was carried out in three different geographical locations (Bhavnagar-Ghogha, Dahej-Vagra, and Hansot-Ankleshwar). In completing the survey, a total of 6,783 responses (households) were recorded based on 200 questions. Responses were obtained from the survey from over 90% of households in the villages. Apart from the household surveys, focused group discussions (FGDs) were conducted in a number of villages. The FGDs have offered important insights regarding the social interactions, issues, challenges, and the benefits and limitations of development projects in their respective societies.
The construction of the dyke is likely to increase water level in the downstream areas. Therefore, three possible scenarios emerge. First, in which the rise in water induces possible relocation of communities (where there is very less scope of mitigating the threats). The second scenario, in which the rise in water degrades, the available resources in the region on which people are dependent. Here, the scope for adaptation exists, but it requires necessary policy interventions. And the third scenario, conclude the rise in water does not impact significantly and might positively contribute to the better livelihoods of the people.
The basic amenities data were analyzed for educational, infrastructure and medical facilities, drinking water quality and rehabilitation and resettlement scenarios. The economy of the study area is based mainly on agriculture and industrial activities in some parts of the surveyed area. With respect to occupation, agriculture and labour related to agriculture are the prime professions in almost all the talukas; this is followed by diamond cutting. Animal husbandry, trading and private business are observed in few talukas, while service is quite uncommon among all the talukas surveyed. As far as industrial development is concerned, eastern side of the Gulf of Khambhat is highly industrialised than the western side of the Gulf. Presence of industries on eastern side improved the overall quality of life of the people as per the study conducted.
7.1 Mitigation for downstream inundation in Post Dyke Scenario
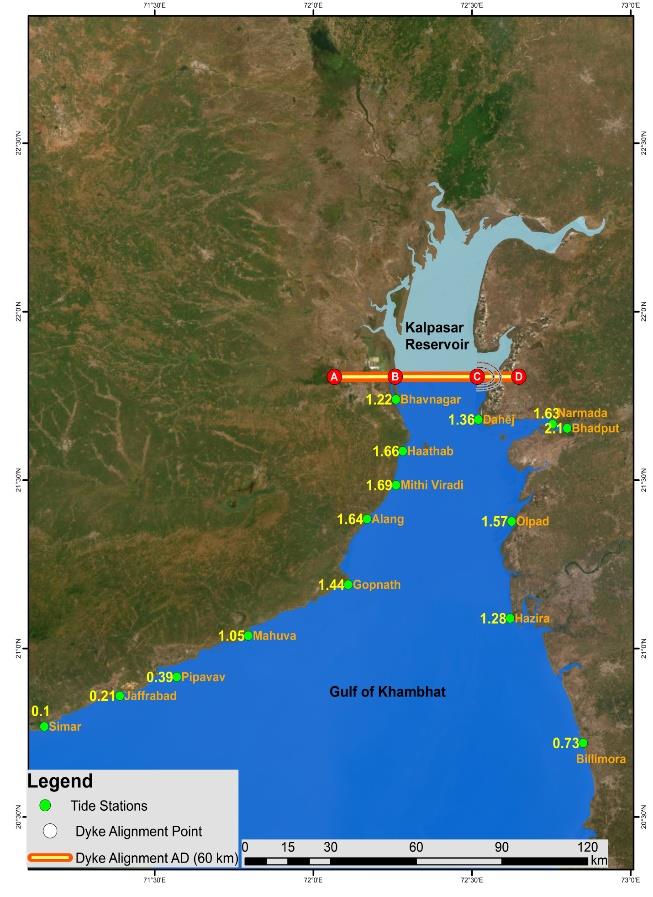
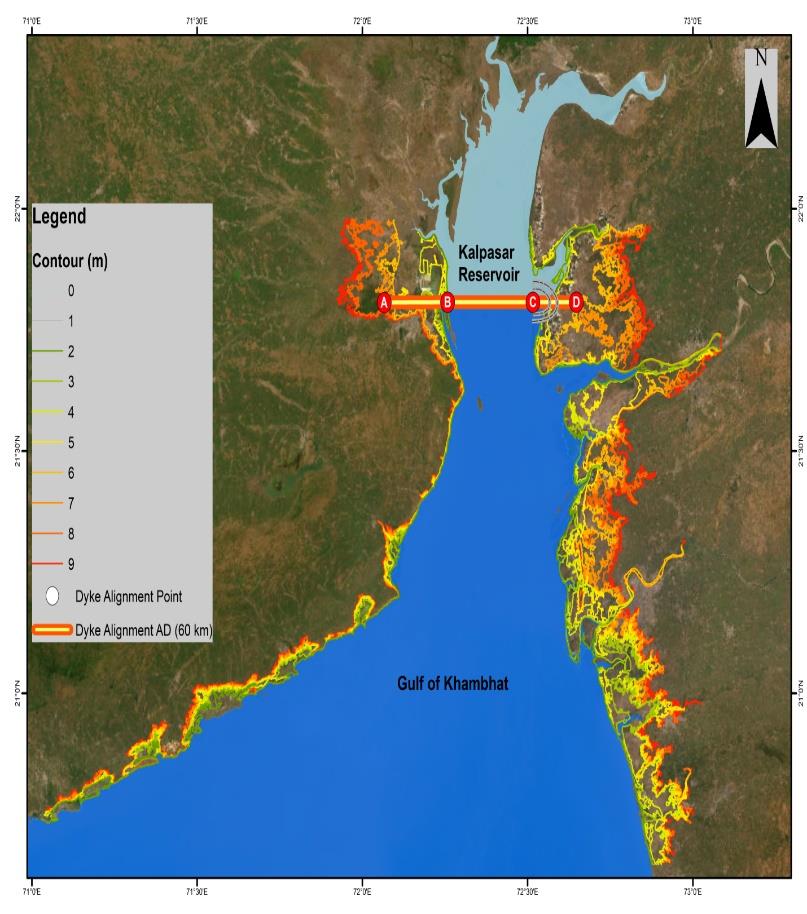
Water levels play a crucial role in the construction and operation of dykes, as they serve as a protective measure against the occurrence of inundation, or flooding, in both the areas located upstream and downstream of the dyke structure. The effective regulation of water levels is imperative in order to safeguard the structural integrity of the dyke, the adjacent regions, and the communities situated downstream. The influence of water levels on downstream inundation is substantial and holds a pivotal position in ascertaining the magnitude and intensity of flooding that may transpire in areas located downstream. Water levels are frequently linked to various factors such as river flow, dam releases, and other activities and have a direct impact on the probability and magnitude of flooding in downstream areas. The water level changes that may arise due to the construction of dyke has been assessed, associated risks to low-lying islands, coasts, cities, areas and settlements, and response options and pathways to resilience and sustainable development.
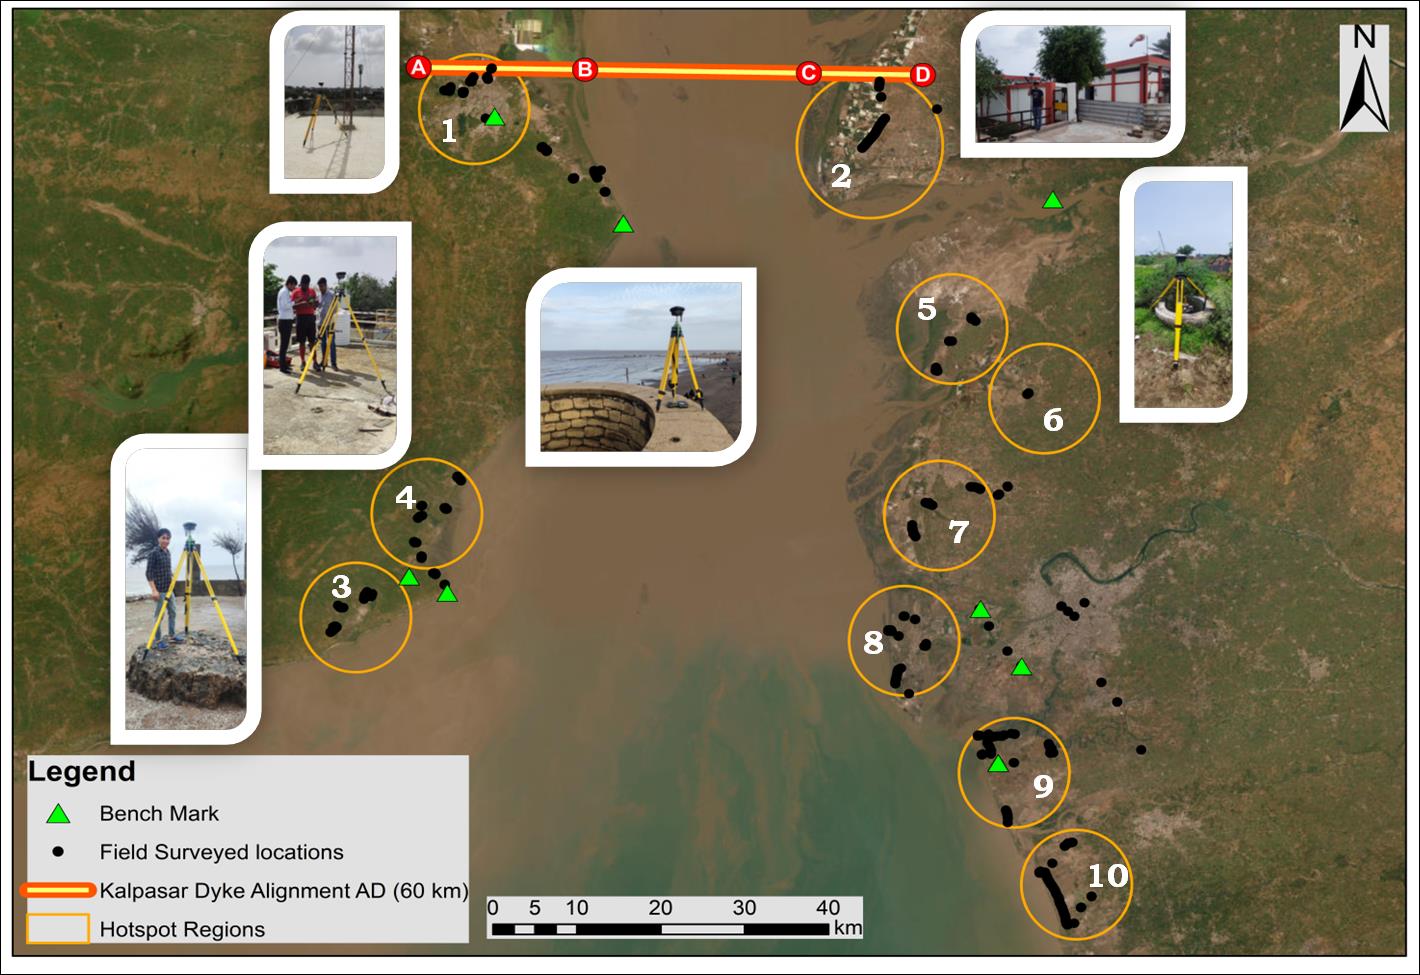
The implementation of the Kalpasar Project is anticipated to induce alterations in the hydrodynamics of the Gulf, potentially resulting in modifications to the levels of high and low water, as well as the patterns of sedimentation within the Gulf. To investigate the influence of this phenomenon, the calibrated hydraulic and hydrodynamic (HD) model was employed to replicate different scenarios, both with and without the implementation of the suggested dyke. The primary factors influencing the highest water level in the downstream region are tidal patterns, storm surges, and the rise in sea levels. The scenarios were derived from the observed rise in water table levels. For pre and post dyke scenarios, comparison of increase in the water levels is shown in the Figure 7.1 (a). The extent of inundation is primarily influenced by topography, specifically the slopes of the beach. The topography in the downstream region is derived through the integration of ALTM Data and SRTM Data, as depicted in Figure 7.1 (b). The data acquired from the Airborne Laser Terrain Mapper (ALTM) and Shuttle Radar Topography Mission (SRTM) Digital Elevation Models (DEMs) is subsequently validated through the use of Differential Global Positioning System (DGPS) in field surveys. During the process of field verification, a total of six new benchmarks were established. Additionally, a comprehensive survey was conducted, encompassing a total of 6687 data points. Using ALTM and SRTM DEM, followed by the corrections incorporated with respect to the data collected from field, village wise percentage of inundation is calculated. Ten (10) hotspots were identified based on the extent of flooding in their respective regions Figure 7.2. As evidenced by the observations, no villages are expected to be inundated above 50%; however, 2 villages are projected to experience inundation between 25% and 50%, 21 villages are projected to experience inundation between 10% and 25%, and 123 villages may experience inundation between 1% and 10%, which is very minimal.
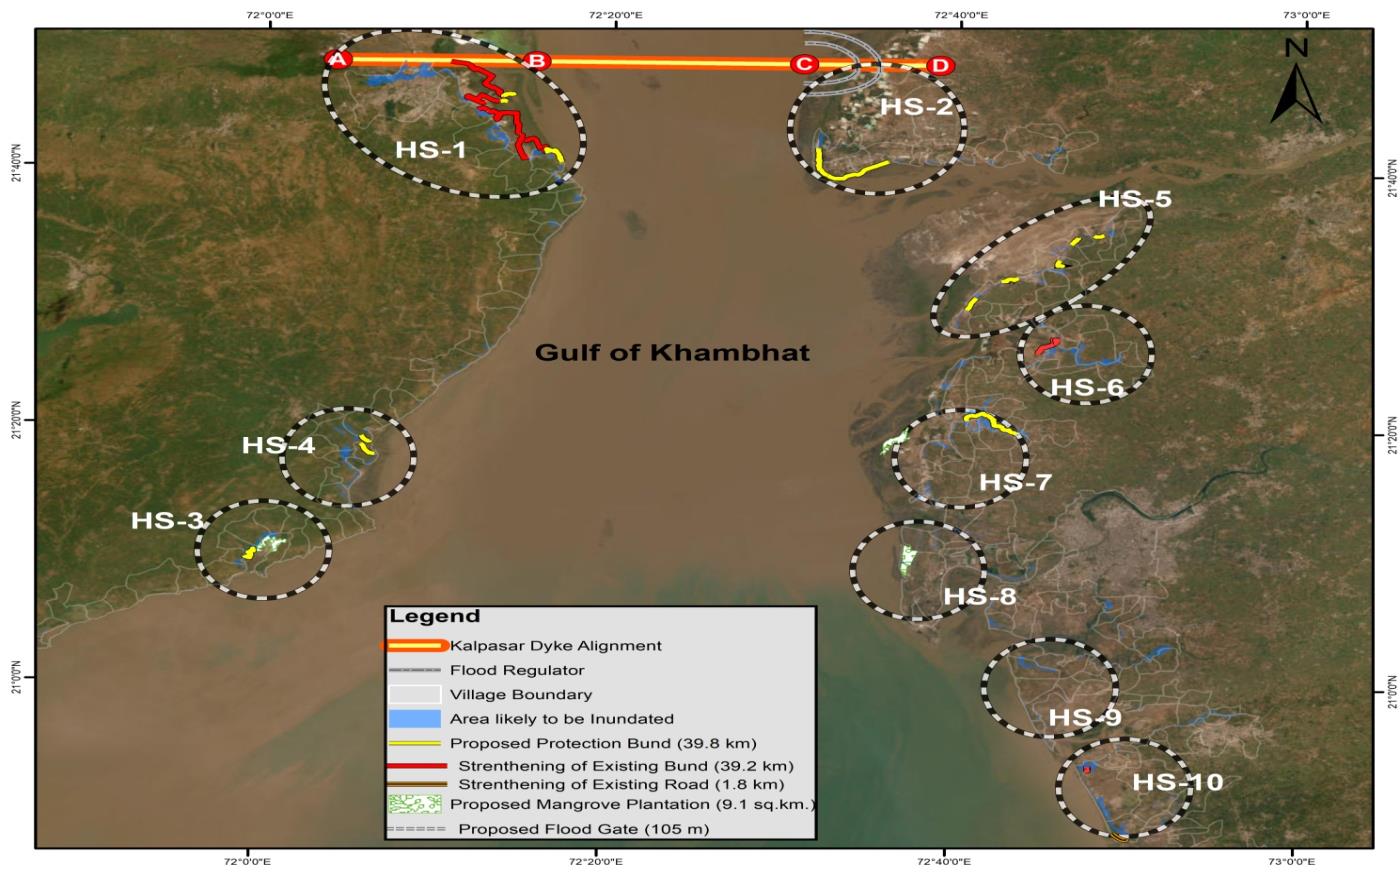
7.1.1 Protection Measures
In order to address the consequences of water level elevation resulting from the construction of the Kalpasar dyke, it is suggested that five distinct classifications of mitigation and protection, specifically structural measures, be implemented. The proposed protection measures were outlined in the Table 7.1 while Figure 7.3 displayed the maps illustrating the specific details of these measures.
The study focuses on the alteration of water levels resulting from the construction of the dyke, as well as the subsequent ramifications of the inundation of the adjacent regions. The management of water levels during dyke construction and operation is a multifaceted undertaking that necessitates the integration of engineering proficiency, continuous monitoring, and preparedness for unforeseen circumstances. In order to safeguard the integrity of the dyke structure and prevent the surrounding areas from being flooded, a range of suitable mitigation measures and protective infrastructure were proposed. These measures were designed to address both the immediate safety concerns and the potential environmental impacts associated with the dyke structure.
| Hotspot | Proposed Protection Bund (km) | Strengthening of Existing Bund (km) | Proposed Mangrove Plantation (sq.km.) | Strengthening of Existing Road (km) | Proposed Flood Gate (km) |
|---|---|---|---|---|---|
| Hotspot-1 | 6.2 | 34.7 | – | – | – |
| Hotspot-2 | 11.6 | – | – | – | – |
| Hotspot-3 | 3.435 | – | 2.8 | – | – |
| Hotspot-4 | 3.5 | – | – | – | – |
| Hotspot-5 | 7.9 | – | – | – | – |
| Hotspot-6 | – | 4.5 | – | – | – |
| Hotspot-7 | 7.8 | – | 2.8 | – | 0.105 |
| Hotspot-8 | – | – | 3.5 | – | – |
| Hotspot-9 | – | – | – | – | – |
| Hotspot-10 | – | – | – | 1.8 | – |
| Total | 39.835 | 39.2 | 9.1 | 1.8 | 0.105 |